

Note
Go to the end to download the full example code.
Largest connected component#
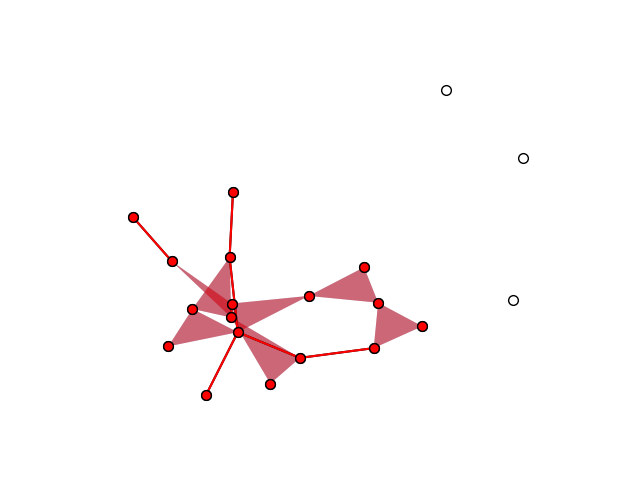
Compute and draw the largest connected component.
import matplotlib.pyplot as plt

import xgi

# generate hypergraph
seed = 12
H = xgi.fast_random_hypergraph(20, [0.05, 0.01], seed=seed)

# compute the largest component hypergraph
H_gcc = xgi.largest_connected_hypergraph(H)

# draw hypergraph
pos = xgi.barycenter_spring_layout(H, seed=seed)
xgi.draw(H, pos=pos)
xgi.draw(H_gcc, pos=pos, node_fc="r", edge_fc="r", dyad_color="r")

plt.show()
Total running time of the script: (0 minutes 0.026 seconds)